On this page
Clean Food and Dirty Info
Information Diet is hugely important. I think it will be one of the big topics of the next few years.
Modern people: extremely careful about whether every piece of food that goes into their mouth is clean food, yet completely indifferent to the pile of dirty info they eat online.
You wouldn’t eat potato chips for three meals a day, because you know your body would break down. But plenty of people scroll short videos for three hours a day and read dozens of Threads arguments, and don’t think their brain will break down.
After saying that, I did two things: pulled the Chrome history db, then analyzed my browsing habits. Here are a few sections of what came out. It talks to me in the second person.
Those 2,357 Threads Visits Aren’t What I Thought
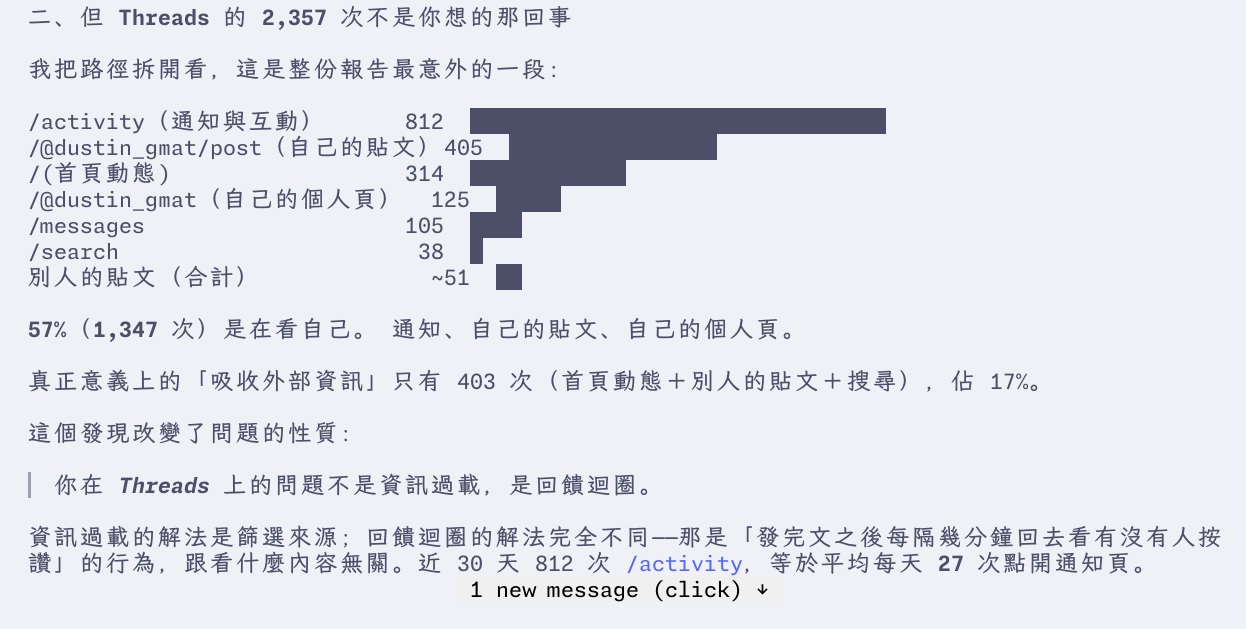
- But those 2,357 Threads visits aren’t what you think
I broke the paths apart, and this is the most surprising section of the whole report:
/activity (notifications and interactions) 812 / /@dustin_gmat/post (your own posts) 405 / / (home feed) 314 / /@dustin_gmat (your own profile) 125 / /messages 105 / /search 38 / other people’s posts (combined) ~51
57% (1,347 visits) is you looking at yourself. Notifications, your own posts, your own profile page.
Genuine “taking in outside information” is only 403 visits (home feed + other people’s posts + search), 17%.
This finding changes the nature of the problem:
“Your problem on Threads isn’t information overload, it’s a feedback loop.”
The fix for information overload is filtering sources; the fix for a feedback loop is something else entirely — it’s the behavior of going back every few minutes after posting to see if anyone liked it, and it has nothing to do with what you’re reading. 812 /activity visits in the last 30 days works out to 27 taps on the notification page per day.
Intake to Landing: Tools
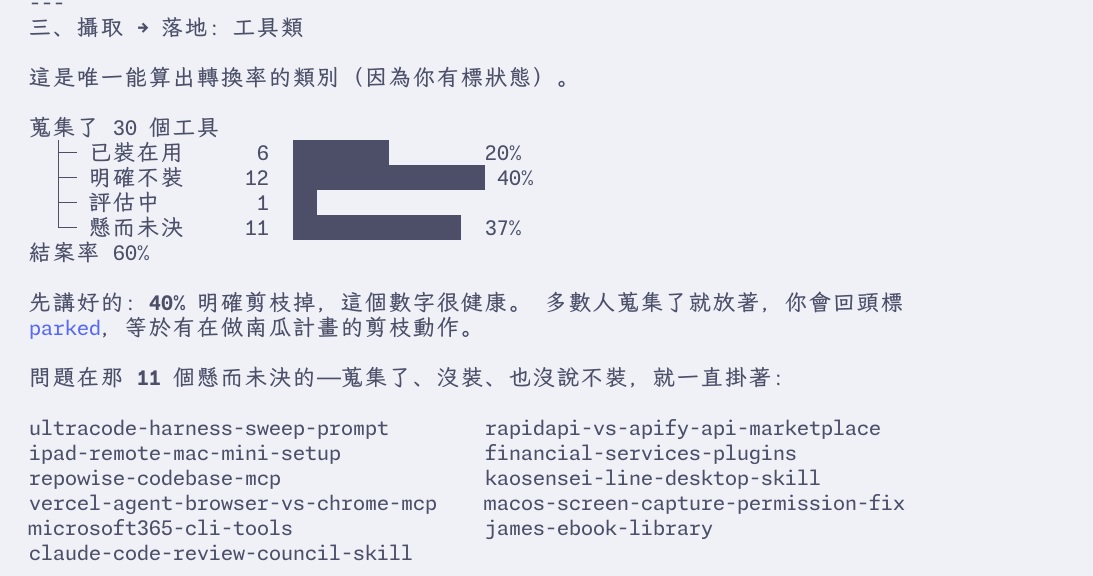
- Intake → landing: tools
This is the only category where a conversion rate can be computed (because you tag status).
30 tools collected: installed and in use 6 (20%) / explicitly not installing 12 (40%) / under evaluation 1 / left hanging 11 (37%). Closure rate 60%.
The good part first: 40% explicitly pruned away, and that’s a healthy number. Most people collect and then let it sit; you go back and mark things parked, which is the pruning move from The Pumpkin Plan.
The problem is those 11 left hanging — collected, not installed, not declared dead either, just sitting there: ultracode-harness-sweep-prompt, rapidapi-vs-apify-api-marketplace, ipad-remote-mac-mini-setup, financial-services-plugins, repowise-codebase-mcp, kaosensei-line-desktop-skill, vercel-agent-browser-vs-chrome-mcp, macos-screen-capture-permission-fix, microsoft365-cli-tools, james-ebook-library, claude-code-review-council-skill
Three Zero-Retention Sources
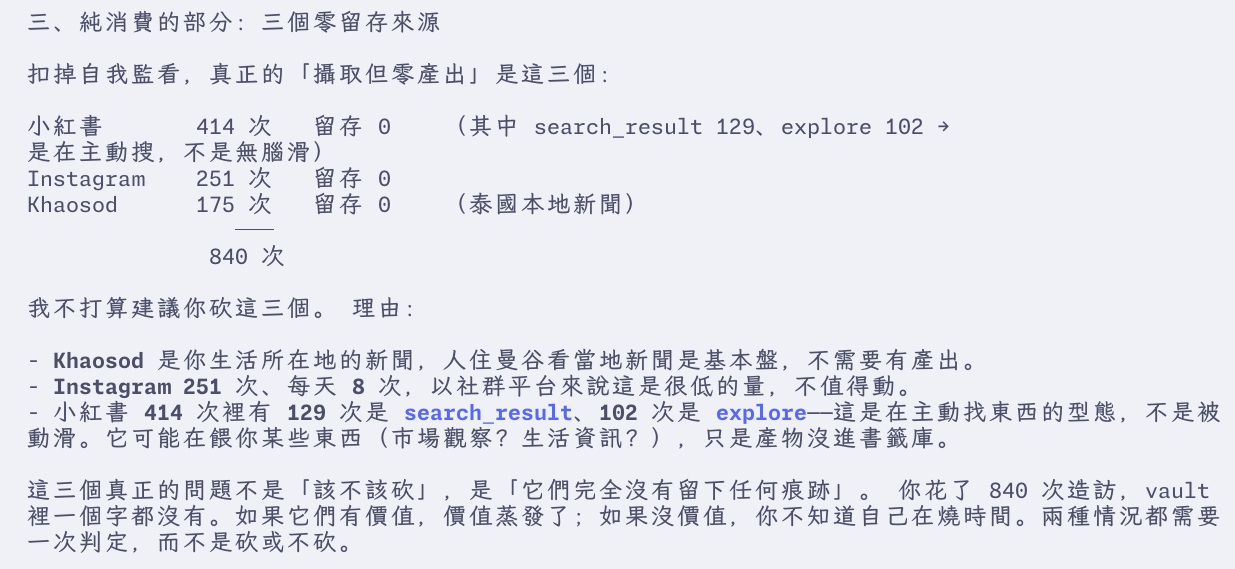
- The pure consumption part: three zero-retention sources
Setting aside self-monitoring, the real “intake with zero output” is these three: Xiaohongshu 414 visits, retention 0 (of which search_result 129, explore 102 → you’re actively searching, not mindlessly scrolling) / Instagram 251 visits, retention 0 / Khaosod 175 visits, retention 0 (local Thai news). 840 in total.
I’m not going to suggest you cut these three. The reasons: Khaosod is news from where you live, and someone living in Bangkok reading local news is baseline, it doesn’t need to produce output. Instagram at 251 visits, 8 a day, is a very low number for a social platform and isn’t worth touching. Of the 414 Xiaohongshu visits, 129 are search_result and 102 are explore — that’s the shape of actively looking for something, not passive scrolling. It may be feeding you something (market observation? life information?), the output just never made it into the bookmark library.
The real problem with these three isn’t “cut or not,” it’s that they leave no trace at all. You spent 840 visits and there isn’t a single word in the vault. If they have value, the value evaporated; if they don’t, you don’t know you’re burning time. Both cases need one judgment call, not a cut-or-keep decision.
What My Day Looks Like
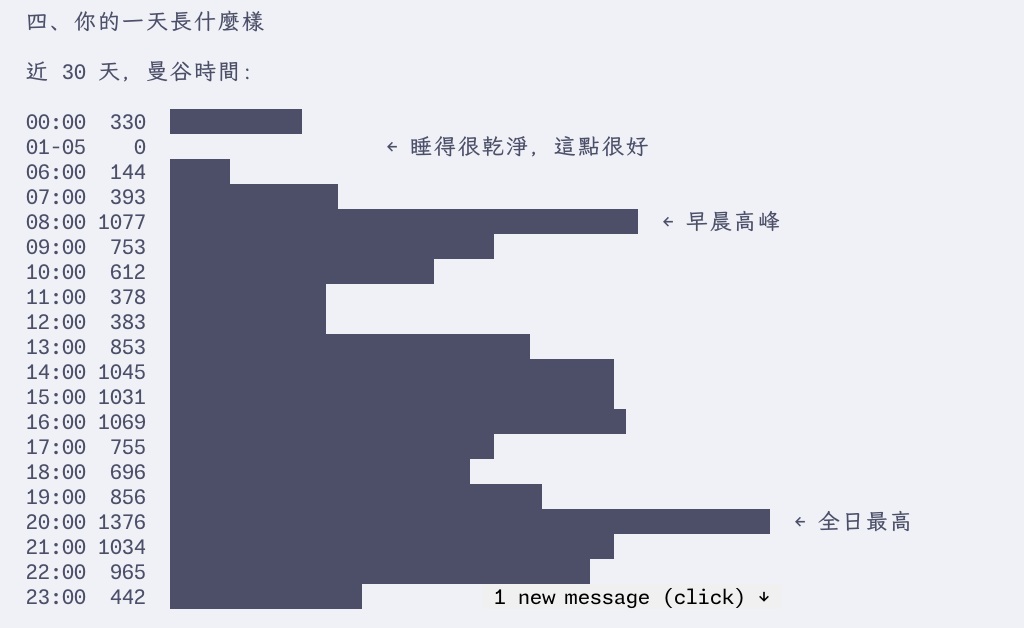
- What your day looks like. Last 30 days, Bangkok time: 00:00 330 / 01-05 0 (you sleep cleanly, that’s good) / 06:00 144 / 07:00 393 / 08:00 1077 (morning peak) / 09:00 753 / 10:00 612 / 11:00 378 / 12:00 383 / 13:00 853 / 14:00 1045 / 15:00 1031 / 16:00 1069 / 17:00 755 / 18:00 696 / 19:00 856 / 20:00 1376 (highest of the day) / 21:00 1034 / 22:00 965 / 23:00 442
Where the Attention Actually Went
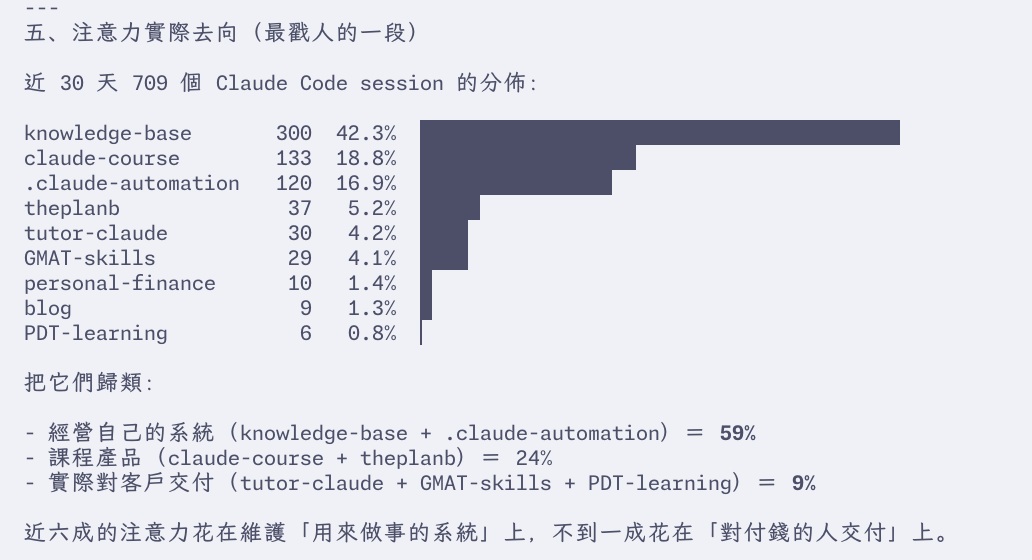
- Where your attention actually went (the section that stings most)
Distribution of 709 Claude Code sessions over the last 30 days: knowledge-base 300 (42.3%) / claude-course 133 (18.8%) / .claude-automation 120 (16.9%) / theplanb 37 (5.2%) / tutor-claude 30 (4.2%) / GMAT-skills 29 (4.1%) / personal-finance 10 (1.4%) / blog 9 (1.3%) / PDT-learning 6 (0.8%)
Grouping them: running your own systems (knowledge-base + .claude-automation) = 59%; course products (claude-course + theplanb) = 24%; actual delivery to clients (tutor-claude + GMAT-skills + PDT-learning) = 9%.
Nearly 60% of the attention goes to maintaining “the systems used to do the work,” and under 10% goes to “delivering to the people who pay.”
That last line is my own machine talking to me, and the numbers are mine too. That’s it.